Export leader
+370 610 11 044
  • Home
  • News
  • Service
  • Business proposals
  • Benefit
  • Trade terms
  • Experience
  • Contact
  • About
English English NO SE

Lithuania export 2014-03-09

3/9/2014

3 Comments


LITHUANIA EXPORTS Exports in Lithuania decreased to 6908 LTL Million in December of 2013 from 7267.60 LTL Million in November of 2013. Exports in Lithuania is reported by the Statistics Lithuania. Exports in Lithuania averaged 2809.24 LTL Million from 1994 until 2013, reaching an all time high of 8100.50 LTL Million in October of 2012 and a record low of 468 LTL Million in October of 1994. Lithuania exports mostly mineral products (Mineral fuels, mineral oils and products of their distillation; bituminous substances; mineral waxes), foodstuffs, machinery and mechanical appliances, electrical equipment and chemicals. Lithuania's main export partners are Russia, Latvia, Germany and Poland. This page provides - Lithuania Exports - actual values, historical data, forecast, chart, statistics, economic calendar and news. 2014-03-09 

News source http://www.tradingeconomics.com/lithuania/exports

3 Comments

Lithuanian exports in the first half of 2013: strong increase in exports of dairy raw materials and challenges faced by small furniture companies in the search for new markets

9/24/2013

1 Comment


Article tutors Enterprise Lithuania Updated: 2013-08-29
 
Compared with the same period in 2012, exports of Lithuanian goods in the first half of 2013 increased by 14.7%, or LTL 5.3 billion, to a total of LTL 41 billion. In June merchandise exports of goods in June saw a 6.6% growth or LTL 423.9 million compared to June 2012, , reaching a value of LTL 6.8 billion. The model for forecasting exports developed by Enterprise Lithuania predicts a 4.3% growth in the export of products of Lithuanian origin (apart from oil products) this year.

Measured by growth in export volumes, Lithuania is still holding the leading position in the Baltic States - in the first half of this year, Latvian exports grew by 7.5%, while Estonian exports grew by 2.5%.  

In the first half of 2013, exports of products of Lithuanian origin increased by 14.6%, or LTL 3.2 billion, to a total of LTL 25.4 billion, while re-exports of goods increased by 15%, or by LTL 2 billion, to LTL 15.6 billion.

“During the first half of 2013, growth in the export of goods of Lithuanian origin was primarily determined by the oil refining industry, the agricultural sector and the food industry," states Vadimas Ivanovas, chief analyst at Enterprise Lithuania. "Faster growth of Lithuanian exports in the first half of the year was slowed down mainly by the chemical industry: declining prices for fertilisers and decreasing export volumes of primary plastics dragged the entire sector down. On the other hand, once redistribution of production capacities in the EU is carried out and scheduled renovations at Lithuanian plants are completed, it is likely that the chemical industry sector will begin to recover.”

Compared with the same period in 2012, food industry exports in the first half of 2013 saw a growth of 13.9%, or LTL 341.5 million, for a total of LTL 2.81 billion. During this period, growth in food industry exports was determined mainly by exports of milk and dairy products, meat and fish products, and meat. Dairy product exports during this period increased by 13.6%, or by LTL 103.7 million, to a total of LTL 867.6 million. The growth was mainly determined by the export of raw milk, cheese and whey.  Raw milk exports reported a growth of 55.8%, or LTL 70.5 million, while whey exports increased by 44.8% or LTL 20 million. The export market demonstrating the greatest growth for these products was Poland, to which  exports of raw milk nearly doubled, with an increase of LTL 47.7 million for a total of LTL 90.6 million; whey exports increased nearly five-fold, by LTL 11.5 million to reach a total of LTL 14.3 million. "Such significant growth in the export of raw materials is related to the shortage of raw materials for dairy production throughout the entire EU that was caused by New Zealand’s problems (the Fonterra case) and the fact that European manufacturers are discovering new export markets. Raw material export prices in the EU have recently increased by at least 10%, and growing volumes of Lithuanian product exports are putting pressure on domestic market prices, causing a shortage of raw materials for Lithuanian dairy producers, although prices for dairy products in export markets are also rising," says Mr Ivanovas about the situation. 

Compared with the same period in 2012, furniture industry exports in the first half of 2013 grew 2.1%, or LTL 32.9 million, to LTL 1.57 billion. During this period, furniture industry export volume growth was primarily determined by exports of seating furniture, which increased 6.4%, or LTL 25.6 million, for a total of LTL 424.7 million. Lithuanian furniture manufacturers are planning to sustain an export growth of 2-4% in the second half of this year as well. However, decreasing demand in Southern European markets (Spain, Portugal, Southern France) may induce changes in export geography. Furniture exports to the USA, Canada, Russia, and the growing Asian markets should increase, as it is namely in these countries that demand is currently on the rise. "The opening of a new IKEA store in Vilnius will affect small Lithuanian furniture producers, as increased competition will force them to look for new markets for their products abroad. However, the majority of smaller companies engaged in furniture production offer high quality, often tailor-made furniture for an attractive price, which gives them a good chance of becoming established in export markets – all they need to do is intensify their search,” says Mr Ivanovas about the opportunities for furniture manufacturers.

In the first half of 2013, exports of oil products and grain had the greatest impact on geographic changes in the export of Lithuanian goods. Orlen Lietuva increased sales and market share in the Baltics, while grain exports to Iran increased by LTL 441 million.


1 Comment

Foreign trade in January 2013

3/9/2013

1 Comment

 
Foreign trade in January 2013

Statistics Lithuania informs that, based on non-final data obtained from customs declarations, Intrastat reporting and VAT returns data, exports in January 2013 amounted to LTL 6.5 billion, imports – LTL 7.4 billion. Exports of goods of Lithuanian origin amounted to LTL 4.4 billion. The foreign trade deficit of Lithuania amounted to LTL 0.9 billion.

Over the month (in January 2013, against December 2012), exports decreased by 7.6 per cent. This was influenced by a decrease in exports of boilers, machinery and mechanical appliances, parts thereof – by 36.9, cereals – 37.9 per cent. Imports increased by 4.3 per cent, which was influenced by an increase in imports of crude petroleum – by 41.3 per cent. Mineral products excluded, exports and imports of goods decreased by 8.9 and 8.4 per cent respectively. Exports of goods of Lithuanian origin increased by 3, mineral products excluded – 6.6 per cent.

In January 2013, against January 2012, exports grew by 15.4 per cent. This was influenced by an increase in exports of petroleum products – by 13.2 per cent, cereals – 2.9 times, furniture – 25.4 per cent. Imports increased by 14.2 per cent, which was determined by an increase in imports of crude petroleum – by 25.4, boilers, machinery and mechanical appliances, parts thereof – 20.5, electrical machinery and equipment and parts thereof – 22.3 per cent. Mineral products excluded, exports and imports of goods increased by 15.9 and 14.5 per cent respectively. Exports of goods of Lithuanian origin increased by 14.2, mineral products excluded – 13.5 per cent.

In January 2013, the most important partners in exports were Russia (14.6 per cent), Latvia (9.3 per cent), Germany (8.1 per cent), and Estonia (7.4 per cent), in imports – Russia (41.8 per cent), Poland (8.3 per cent), Germany (8.1 per cent), and Latvia (5.1 per cent). Most of goods of Lithuanian origin were exported to the United Kingdom (10.3 per cent), Germany (10.1 per cent), the Netherlands (8.9 per cent), and Estonia (8 per cent).

In January 2013, the largest share in exports and imports fell within mineral products (24.8 and 42.9 per cent respectively), machinery and mechanical appliances, electrical equipment (9.2 and 10.2 per cent), products of the chemical or allied industries (9 and 8.8 per cent). As for the goods of Lithuanian origin, the largest share in exports fell within mineral products (38.2 per cent), products of the chemical or allied industries (8.9 per cent), and miscellaneous manufactured articles (8 per cent).

© Statistics Lithuania

1 Comment

Foreign trade in November 2012

1/10/2013

0 Comments

 
Statistics Lithuania informs that, based on non-final data obtained from customs declarations, Intrastat reporting and VAT returns data, exports in November 2012 amounted to LTL 7.7 billion, imports – LTL 7.8 billion. Exports of goods of Lithuanian origin amounted to LTL 4.8 billion. The foreign trade deficit of Lithuania amounted to LTL 0.1 billion. 

Over the month (in November 2012, against October), exports decreased by 4.5 per cent. This was influenced by a decrease in exports of petroleum products – by 8.1 per cent, cereals – 18.7 per cent, oil seeds and oleaginous fruits, miscellaneous grains – 41.3 per cent. Imports decreased by 7 per cent, which was influenced by a decrease in imports of crude petroleum – by 12.4 per cent, ground vehicles – 24.7 per cent. Mineral products excluded, exports and imports of goods decreased by 3.8 and 3.7 per cent respectively. Exports of goods of Lithuanian origin decreased by 6.9 per cent, mineral products excluded – 8 per cent.

Over the year (in November 2012, against November 2011), exports grew by 24.9 per cent, which was influenced by an increase in exports of petroleum products – by 16.5 per cent, cereals – 3 times. Imports increased by 10.6 per cent, which was determined by an increase in imports petroleum products – by 44.5 per cent, fertilisers – 2.1 times. Mineral products excluded, exports and imports of goods increased by 27.4 and 14.9 per cent respectively. Exports of goods of Lithuanian origin increased by 20.2 per cent, mineral products excluded – by 21.3 per cent.

In January–November 2012, against the same period of 2011, exports and imports grew by 14.1 and 9.2 per cent respectively. Mineral products excluded, exports and imports of goods increased by 15.9 and 8 per cent respectively. Exports of goods of Lithuanian origin increased by 8.8 per cent, mineral products excluded – 11.9 per cent. An increase in exports was influenced by an increase in exports of petroleum products – by 9.6 per cent, boilers, machinery and mechanical appliances, parts thereof – 33.9 per cent, furniture – 22.3 per cent. An increase in imports was influenced by an increase in imports of petroleum products – by 69.9 per cent, boilers, machinery and mechanical appliances, parts thereof – 8 per cent, plastics and articles thereof – 15.9 per cent.

In January–November 2012, the most important partners in exports were Russia (18.6 per cent), Latvia (11 per cent), Germany (7.9 per cent), and Estonia (7.7 per cent), in imports – Russia (32.4 per cent), Germany (9.9 per cent), Poland (9.7 per cent), and Latvia (6 per cent). Most of goods of Lithuanian origin were exported to Germany (10.6 per cent), Latvia (10.1 per cent), Estonia (9.3 per cent), and the United Kingdom (9 per cent).

In January–November 2012, the largest share in exports and imports fell within mineral products (24.5 and 35.1 per cent respectively), machinery and mechanical appliances, electrical equipment (11.2 and 12.1 per cent), products of the chemical or allied industries (8.9 and 10.2 per cent). As for the goods of Lithuanian origin, the largest share in exports fell within mineral products (34.4 per cent), products of the chemical or allied industries (8.6 per cent), and miscellaneous manufactured articles (7.8 per cent).

© Statistics Lithuania

0 Comments

Lithuania foreign trade in October 2012 

12/10/2012

1 Comment

 
Statistics Lithuania informs that, based on non-final data obtained from customs declarations, Intrastat reporting and VAT returns data, exports in October 2012 amounted to LTL 8.1 billion, imports – LTL 8.4 billion. Exports of goods of Lithuanian origin amounted to LTL 5.2 billion. The foreign trade deficit of Lithuania amounted to LTL 0.3 billion. 

Over the month (October 2012, against September), exports increased by 12.2 per cent. It was influenced by an increase in exports of ground vehicles (by 38.4 per cent), boilers, machinery and mechanical appliances, parts thereof (29.8 per cent), and cereals (43.8 per cent). Imports increased by 4 per cent, which was determined by an increase in imports of boilers, machinery and mechanical appliances, parts thereof (by 21.4 per cent) and ground vehicles (10.3 per cent). Mineral products excluded, exports and imports increased by 16.5 and 15.2 per cent respectively. Exports of goods of Lithuanian origin grew by 7.1 per cent, mineral products excluded – by 10.3 per cent.

Over the year (October 2012, against October 2011), exports grew by 33 per cent. It was influenced by an increase in exports of petroleum products (by 33.1 per cent) and cereals (3.8 times). Imports grew by 20.3 per cent, which was influenced by an increase in imports of crude oil (by 18.9 per cent) and ground vehicles (40.3 per cent). Mineral products excluded, exports of goods increased by 35.1 per cent, imports – by 21.6 per cent. Exports of goods of Lithuanian origin increased by 28.6 per cent, mineral products excluded – by 30.7 per cent.

In January–October 2012, against the same period in 2011, exports and imports grew by 12.9 and 9 per cent respectively. Mineral products excluded, exports increased by 14.6, imports – 7.3 per cent. Exports of goods of Lithuanian origin increased by 7.5 per cent, mineral products excluded – 10.7 per cent. The increase in exports was influenced by an increase in exports of boilers, machinery and mechanical appliances, parts thereof – by 34.4 per cent, petroleum products – 8.8 per cent, furniture – 22.9 per cent. An increase in imports was influenced by an increase in imports of crude oil – by 7.6 per cent, boilers, machinery and mechanical appliances, parts thereof – 8.6 per cent, plastics and articles thereof – 15.5 per cent.

In January–October 2012, the most important partners in exports were Russia (18.4 per cent), Latvia (11.2 per cent), Germany (8 per cent), and Estonia (7.7 per cent), in imports – Russia (32.4 per cent), Germany (9.9 per cent), Poland (9.7 per cent), and Latvia (6 per cent). Most of the goods of Lithuanian origin were exported to Germany (10.8 per cent), Latvia (10.3 per cent), Estonia (9.2 per cent), and the United Kingdom (9.1 per cent).

In January–October 2012, the largest proportion in exports and imports fell within mineral products (24.5 and 35.3 per cent respectively), machinery and mechanical appliances, electrical equipment (11.2 and 12 per cent), products of the chemical or allied industries (9 and 10.2 per cent). As for the goods of Lithuanian origin, the largest proportion in exports fell within mineral products (34.2 per cent), products of the chemical or allied industries (8.8 per cent), miscellaneous manufactured articles (7.9 per cent).

© Statistics Lithuania

1 Comment

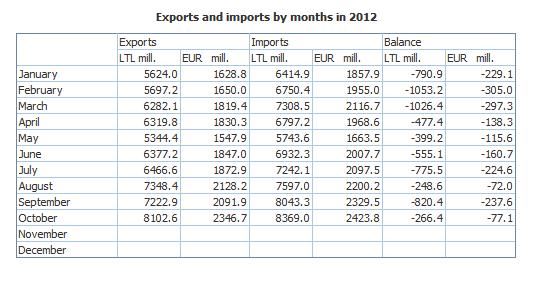
Lithuania exports and imports by months in 2012

12/10/2012

0 Comments

 
Picture
0 Comments

Lithuanian foreign trade in April 2012  

6/8/2012

1 Comment

 
Statistics Lithuania informs that, based on non-final data obtained from customs declarations, VAT returns and Intrastat reporting data, exports in April 2012 amounted to LTL 6.3 billion, imports – LTL 6.8 billion. Exports of goods of Lithuanian origin amounted to LTL 4 billion. Foreign trade deficit of Lithuania amounted to LTL 0.5 billion.  

Over the month (in April 2012, against March), exports increased by 0.8 per cent. This was influenced by an increase in exports of petroleum products – by 29.1 per cent, milk and milk products – 32.4 per cent. Imports decreased by 6.7 per cent, which was determined by a decrease in imports of natural gas – by 20.3 per cent, natural calcium phosphates – 61.8 per cent. Mineral products excluded, exports and imports of goods decreased by 6.4 and 6.6 per cent respectively. Exports of goods of Lithuanian origin increased by 2.4 per cent, mineral products excluded – decreased by 11.8 per cent. An increase in exports of goods of Lithuanian origin was determined by an increase in exports of petroleum products – by 32.8 per cent, milk and milk products – 25.3 per cent.

In April 2012, against April 2011, exports grew by 21.7 per cent, which was influenced by an increase in exports of petroleum products – 2.2 times, boilers, machinery and mechanical appliances, parts thereof – 29.6 per cent. Imports grew by 7.7 per cent, which was determined by an increase in imports of petroleum products – by 89 per cent, various chemical products – 66.5 per cent. Mineral products excluded, exports and imports of goods increased by 3.9 and 5.1 per cent respectively. Exports of goods of Lithuanian origin increased by 28.1 per cent, mineral products excluded – decreased by 0.2 per cent.

In January–April 2012, against the same period of 2011, exports and imports grew by 14 and 11.9 per cent respectively. Mineral products excluded, exports and imports of goods increased by 7.8 and 5.2 per cent respectively. Exports of goods of Lithuanian origin increased by 13.6 per cent, mineral products excluded – 5.8 per cent. An increase in exports was influenced by an increase in exports of petroleum products – by 37 per cent, boilers, machinery and mechanical appliances, parts thereof – 34.6 per cent, furniture – 21.7 per cent. An increase in imports was influenced by an increase in imports of crude petroleum – by 20.6 per cent, boilers, machinery and mechanical appliances, parts thereof – 8.1 per cent, plastics and articles thereof – 15.9 per cent.

In January–April 2012, the most important partners in exports were Russia (17.6 per cent), Latvia (10.4 per cent), Germany (8.4 per cent), and Estonia (7.7 per cent), in imports – Russia (35.4 per cent), Poland (9.2 per cent), Germany (9.2 per cent), and Latvia (5.6 per cent). Most of goods of Lithuanian origin were exported to Germany (11.2 per cent), the United Kingdom (11 per cent), the Netherlands (10.7 per cent), and Latvia (9 per cent).

In January–April 2012, the largest share in exports and imports fell within mineral products (26 and 37.9 per cent respectively), machinery and mechanical appliances, electrical equipment (10.5 and 10.8 per cent), products of the chemical or allied industries (9.8 and 10.5 per cent). As for the goods of Lithuanian origin, the largest share in exports fell within mineral products (36.6 per cent), products of the chemical or allied industries (9.7 per cent), and plastics and articles thereof (7.7 per cent).

© Statistics Lithuania

1 Comment

    Author

    Tomas Gertus
    Business Consultant
    tomas@eksportolyderis.lt
    +370 610 11 044, Vilnius   

    Archives

    July 2014
    March 2014
    September 2013
    April 2013
    March 2013
    February 2013
    January 2013
    December 2012
    October 2012
    June 2012

    Categories

    All
    Statistics

    RSS Feed

Service

Manufacturers search
Subcontracting plan
Local exhibitions and contact fairs
Outsourcing
Business proposals


About

Experience
Contact


Support

Help desk
Picture
Proudly powered by Weebly